BartDay
  • Economy
    • Business
    • Politics
  • Cryptocurrency
  • Investing
    • Banking
    • Forex
    • Financial Services
  • Markets
    • Capital Markets
    • Emerging Markets
  • People
    • Consumer & Retail
    • Health
    • Opinion
  • Environment
    • Energy
    • Industrials
    • Manufacturing
  • Technology
    • Learning
    • Auto & Transportation
    • Data
    • Science
    • Telecommunications
  • Featured
  • About
BartDay
BartDay
  • Economy
    • Business
    • Politics
  • Cryptocurrency
  • Investing
    • Banking
    • Forex
    • Financial Services
  • Markets
    • Capital Markets
    • Emerging Markets
  • People
    • Consumer & Retail
    • Health
    • Opinion
  • Environment
    • Energy
    • Industrials
    • Manufacturing
  • Technology
    • Learning
    • Auto & Transportation
    • Data
    • Science
    • Telecommunications
  • Featured
  • About

Resources to Take Your Charts From Bland to Beautiful

  • September 6, 2023
  • 2 minute read
Total
0
Shares
0
0
0
0

There are a lot of considerations when you want to visualize data. It starts with what you want to say, that is what your objectives are, what the chart or graphics conveys. These are only some of the things you need to think about. But one of the objectives is to create both meaningful and beautiful charts. Here are some of the resources you should bookmark.

01. Visual Vocabulary
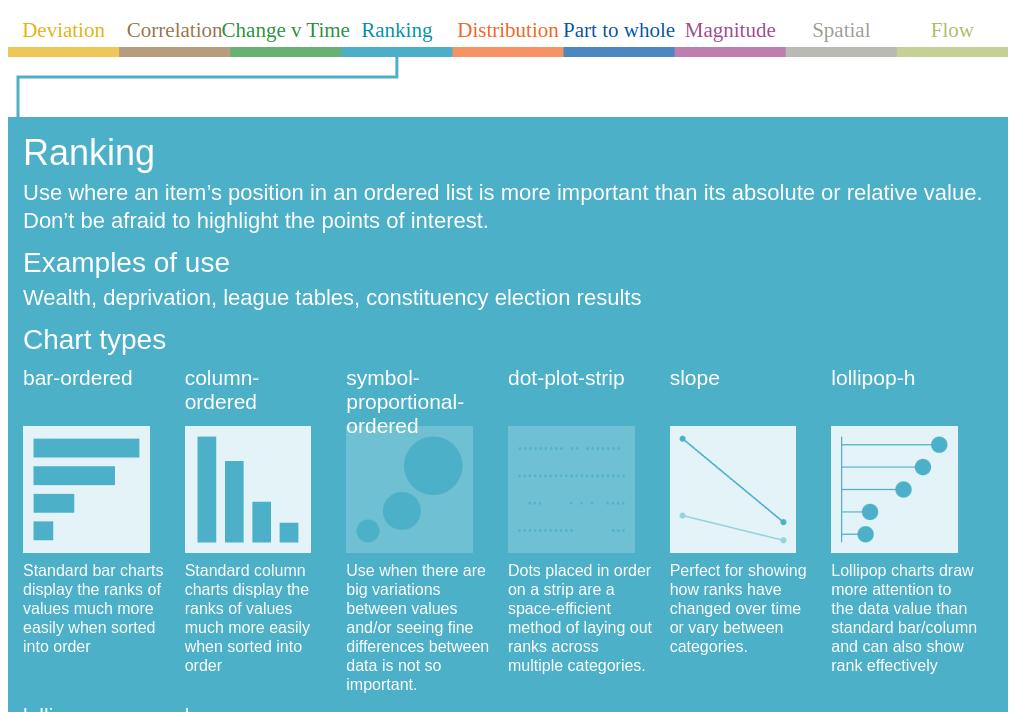
Credits: Visual Vocabulary

In this reference you will be able to choose an appropriate way to visualize your data by selecting from a category. An example use or use case and chart type will be shown. 


Partner with bartday.com. Kindly head here.


From our partners:

CITI.IO :: Business. Institutions. Society. Global Political Economy.
CYBERPOGO.COM :: For the Arts, Sciences, and Technology.
DADAHACKS.COM :: Parenting For The Rest Of Us.
ZEDISTA.COM :: Entertainment. Sports. Culture. Escape.
TAKUMAKU.COM :: For The Hearth And Home.
ASTER.CLOUD :: From The Cloud And Beyond.
LIWAIWAI.COM :: Intelligence, Inside and Outside.
GLOBALCLOUDPLATFORMS.COM :: For The World's Computing Needs.
FIREGULAMAN.COM :: For The Fire In The Belly Of The Coder.
ASTERCASTER.COM :: Supra Astra. Beyond The Stars.
BARTDAY.COM :: Prosperity For Everyone.


https://ft-interactive.github.io/visual-vocabulary/

02. Data Viz Project.com
Credits: Data Viz Project

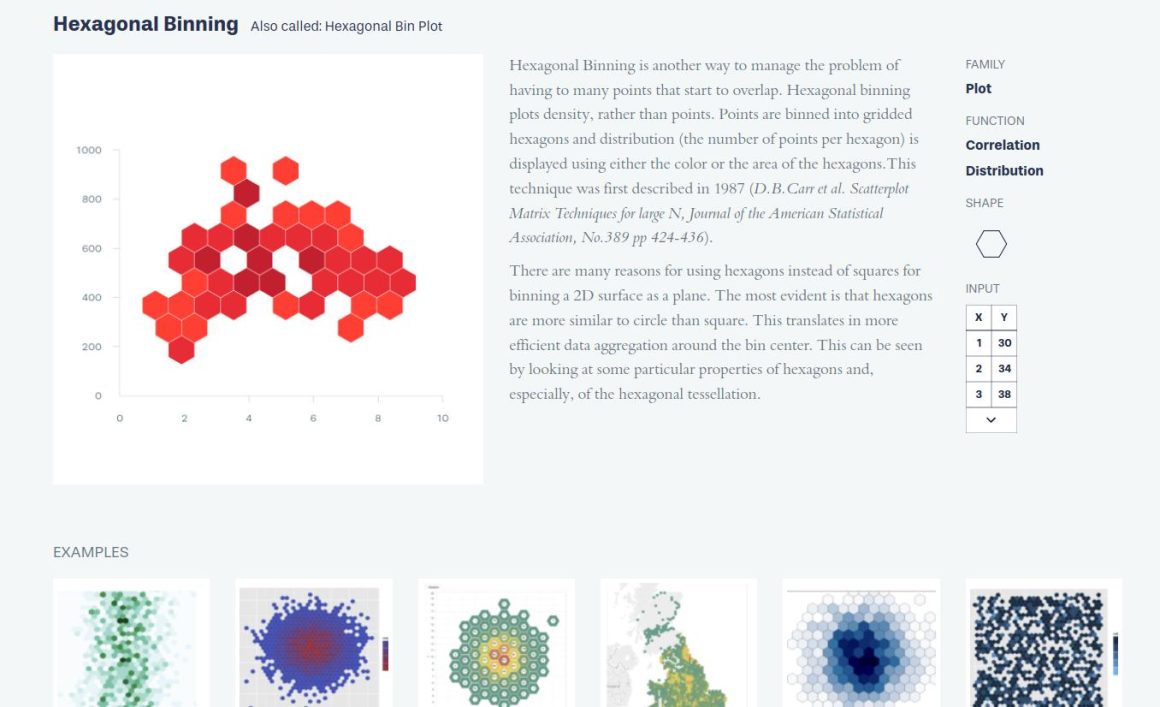
This time a list of chart types is laid out in the home page. If you select a specific chart type, you’d be brought to a page with a detailed description on what this chart is used for, along with examples at the bottom. The neat thing about this, is that at the right side, you’d see the list of Function this chart type is for, and at the bottom are examples.

https://datavizproject.com

03. Dataviz Inspiration

Credits: Dataviz Inspiration

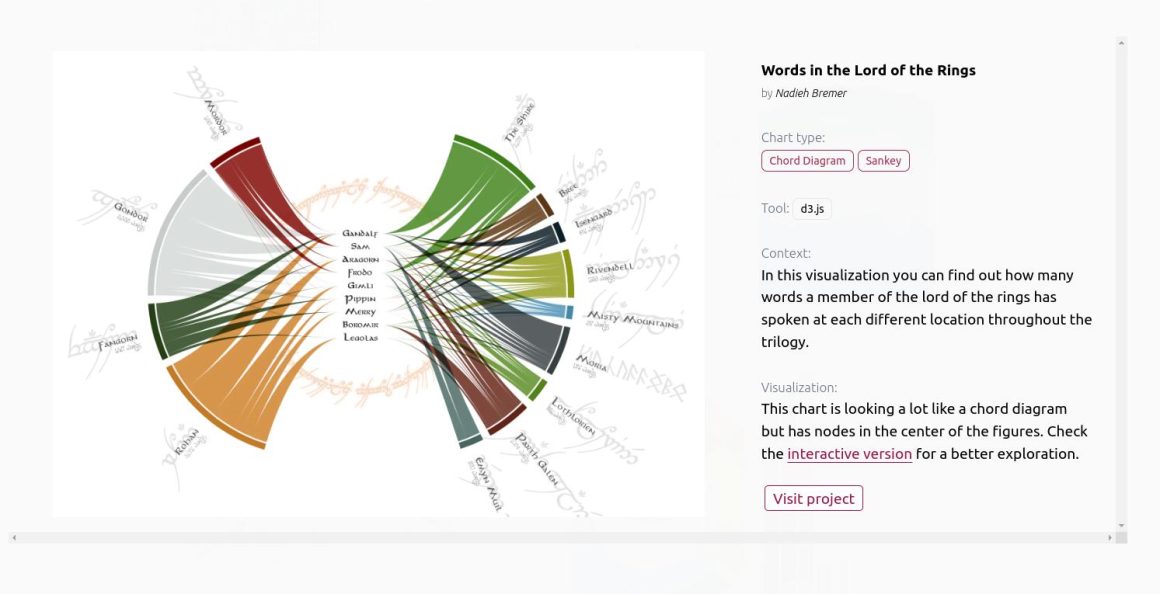
From the main page, a list of proejcts with charts are shown. Then these charts come together with actual data that can be filtered by function. From these examples you can take inspiration on what you want to try and convey with your chart or visualisation.

Another cool thing about this is that you can select the Programming language or tool that was used to generate these charts. From R, Python, tableau, d3.js, react, excel and others. These also have links to the actual project including the source code used.

https://www.dataviz-inspiration.com

04. Xenographics
Credits: Xenographics

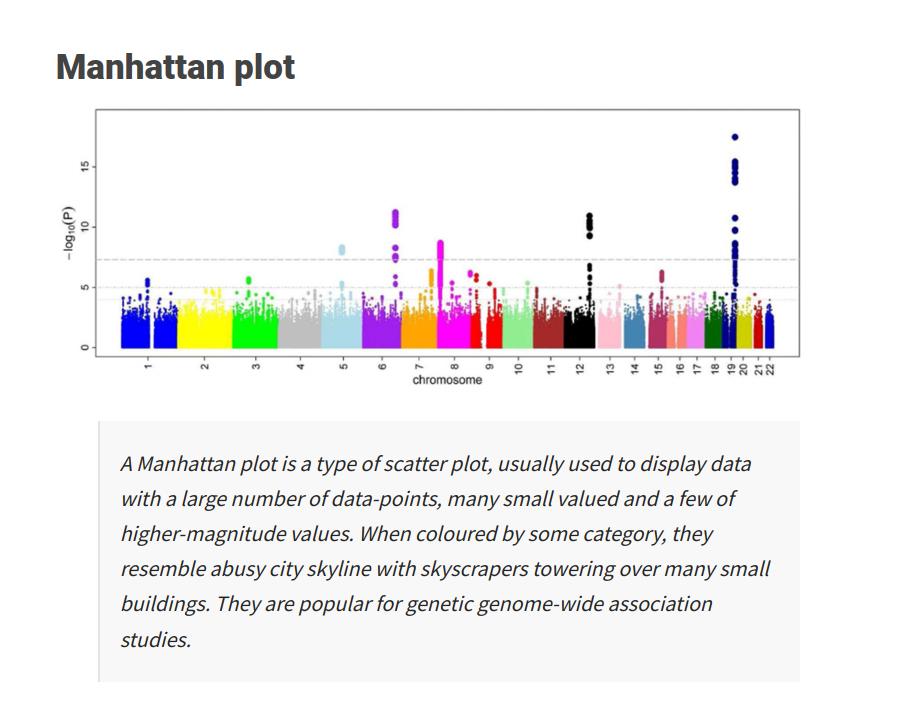
Similar to the previous references, this time you could search for specific chart types using the search bar. Each chart or diagram gives some insights and sometimes weird remarks on some of these charts. Just take a look at “Scatter Pies” and see the comment they made on it. As what they say “Weird but (sometimes) useful charts”

https://xeno.graphics

05. Visalization Cheat Sheets

Credits: Visalization Cheat Sheets

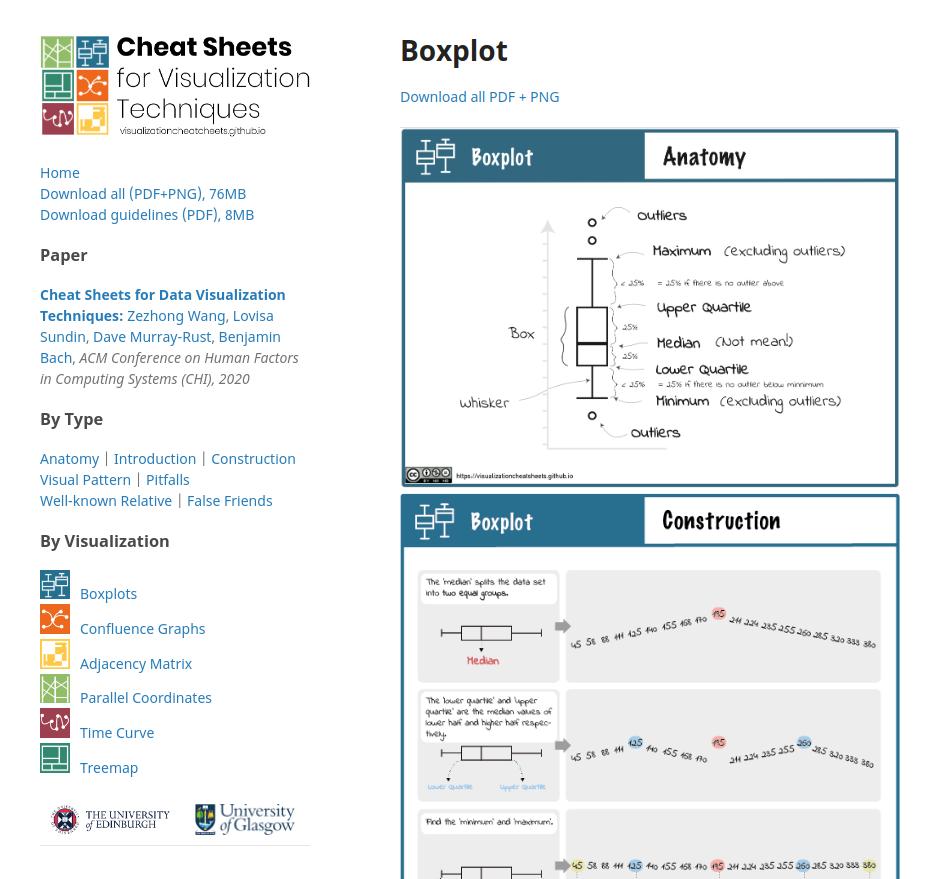
A literal cheat sheet for visualisation. The charts can be filtered by Type and Visualisazation. This one offers detailed description on how to use specific charts. It also explains what these chart conveys, given specific patterns. 

https://visualizationcheatsheets.github.io

06. Chart.js
Credits: Chart.js

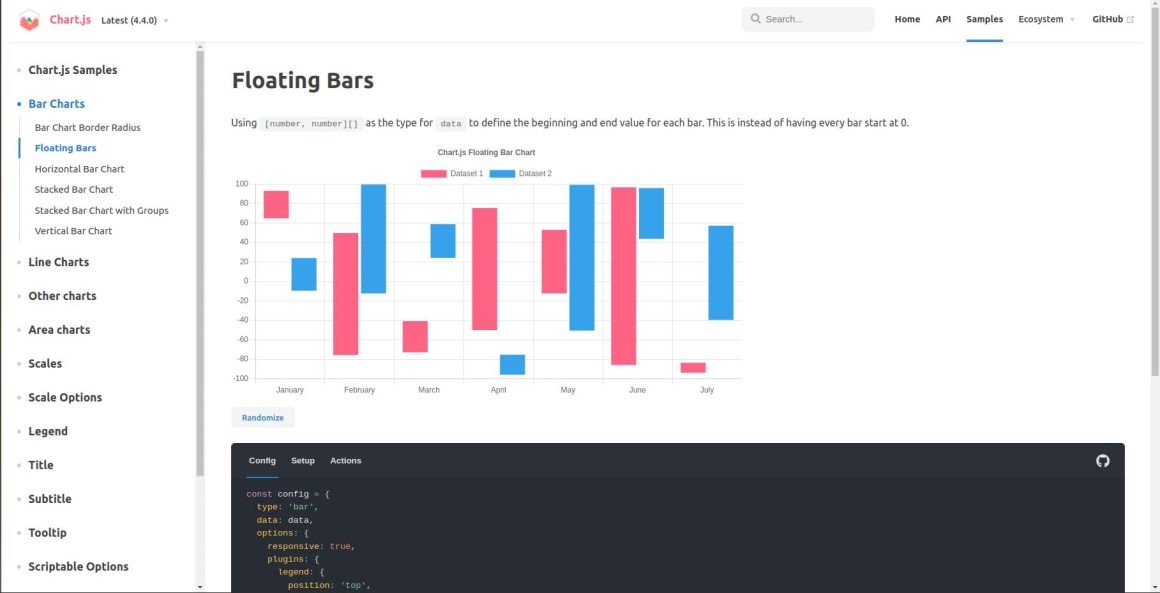
For the programmers, software engineer or those that just want their data to be visualised in a website. This is not really a cheat sheet or reference to decide which chart or visualisation to use, but a software library. It offers a wide array of available charts and step-by-step guide when building your own charts. It does require knowledge in programming.

https://www.chartjs.org

Thank you ZedOptima for sponsoring this article

John Francis

Related Topics
  • Chart
  • Data
  • Data visualisation
  • Learning
You May Also Like
Read More
  • 3 min
  • Data
  • Technology

Hiding in Plain Site: Attackers Sneaking Malware into Images on Websites

  • January 16, 2025
Cloud platforms among the clouds
Read More
  • 2 min
  • Learning
  • Technology

Best Cloud Platforms Offering Free Trials for Cloud Mastery

  • December 23, 2024
IBM and Ferrari Premium Partner
Read More
  • 3 min
  • Data

IBM Selected as Official Fan Engagement and Data Analytics Partner for Scuderia Ferrari HP

  • November 7, 2024
Crab
Read More
  • 2 min
  • Gears
  • Learning
  • Technology

The Best Friends for a Rustacean. Top Books in Learning Rust.

  • August 25, 2024
zednative_channels_winding-road_001
Read More
  • 4 min
  • Data
  • Featured
  • Technology

What’s Next (Maybe) For Generative AI, Foundation Models, Large Language Models, et al. v0.1.

  • March 5, 2024
Read More
  • 2 min
  • Learning

ABC’s of the Linux Nano Editor.

  • October 10, 2023
Read More
  • 2 min
  • Learning

What is a data visualisation?! A predictable pile of digits?

  • October 7, 2023
Dog with glasses using a tablet
Read More
  • 3 min
  • Learning

More Than Math – The Must-Have Non-Technical Skills for Data Pros

  • August 18, 2023
  • The Summer Adventures : Hiking and Nature Walks Essentials
    • June 2, 2025
  • Gemma 3n
    Announcing Gemma 3n preview: powerful, efficient, mobile-first AI
    • May 22, 2025
  • oracle-ibm
    Google Cloud and Philips Collaborate to Drive Consumer Marketing Innovation and Transform Digital Asset Management with AI
    • May 20, 2025
  • college-of-cardinals-2025
    The Definitive Who’s Who of the 2025 Papal Conclave
    • May 7, 2025
  • conclave-poster-black-smoke
    The World Is Revalidating Itself
    • May 6, 2025
about
Unleash Your Financial Potential With Us

BartDay is your all-in source of information for market insights, finance news, investing, trading, and more.

Data and information is provided “as is”. BartDay and any of its information service providers or third party sources is not liable for loss of revenues or profits and damages.

For comments, suggestions, or sponsorships, you may reach us at [email protected]
  • 1
    The Summer Adventures : Hiking and Nature Walks Essentials
    • June 2, 2025
  • Gemma 3n 2
    Announcing Gemma 3n preview: powerful, efficient, mobile-first AI
    • May 22, 2025
  • oracle-ibm 3
    Google Cloud and Philips Collaborate to Drive Consumer Marketing Innovation and Transform Digital Asset Management with AI
    • May 20, 2025
  • college-of-cardinals-2025 4
    The Definitive Who’s Who of the 2025 Papal Conclave
    • May 7, 2025
  • conclave-poster-black-smoke 5
    The World Is Revalidating Itself
    • May 6, 2025
BartDay
  • Economy
  • Cryptocurrency
  • Investing
  • Markets
  • People
  • Environment
  • Technology
  • Featured
  • About
Unleash Your Financial Potential With Us

Input your search keywords and press Enter.